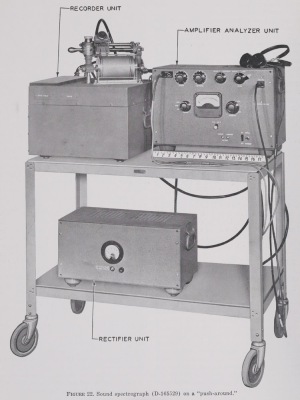
 The sound spectrogram is a playable audio format, even though it’s usually meant to be seen and not heard. Most spectrograms represent types of content that are readily accessible in other, more convenient formats. But if we want to hear what the secret speech-scrambling technologies of the Second World War sounded like, spectrograms printed in once-classified government documents may be our best bet.
As it happens, the sound spectrograph was first developed into workable form as a wartime project specifically for analyzing ciphony, or the encryption and decryption of confidential voice transmissions. Its developers clearly took an interest in applying it to other tasks as well, such as making recorded speech and other sounds visibly decipherable. However, their top priority was the study of scrambled speech, which they illustrated in print with numerous examples, the goal being to train readers to recognize and diagnose different systems.
Meanwhile, I’m not aware of any available non-spectrographic recordings made of scrambled speech during the 1940s or before. Presumably such recordings existed at one time, and it’s not at all unlikely that something survives out there somewhere—a record of an intercepted enemy transmission, say, or an audio sample included in the soundtrack of a training film. But if it does, I haven’t found it, and the only specimens of scrambled-speech audio available online, such as the ones found here, appear to be far more recent. Except for the spectrograms, that is.
When I say spectrograms are “playable,” I mean that they can be played with a bit of effort, and not that they can be played easily with the click of a button or the drop of a needle. The way I do it, they need to be digitized (if this hasn’t already been done), cropped, and loaded into additive synthesis software, and time and frequency parameters need to be set. Most past efforts to play spectrograms—ranging from the analog Pattern Playback and Icophone to the digital Photosounder—have foregrounded the analytical decomposition of old sounds or the synthesis of new ones. However, we can also listen to historical spectrograms just as we’d listen to historical recordings on audiotape or 78 rpm record, as a straightforward means of actualization or eduction, an approach I call paleospectrophony, or “old-spectrum-sounding.” In my book-and-CD publication Pictures of Sound, I presented sound spectrograms of spoken phrases, the cries of bald eagles, sounds of marine life, and whistlers, but these are all subjects we could just as well have heard elsewhere, and I included them mainly as a proof of concept, to prove that paleospectrophony could recognizably transduce bits of legacy audio. After all, playing back a spectrogram probably isn’t the best way for us to learn what a bald eagle sounds like. But when it comes to hearing scrambled speech of the World War Two era, I’m not sure we have any other options.
The relevant spectrograms aren’t at all difficult to access. In 1960, the office of the United States Secretary of Defense declassified a book-length report called Speech and Facsimile Scrambling and Decoding (1946), originally designated “secret” but then already long since downgraded to “confidential.” It had been the third in a series of summary technical reports covering work done during World War Two by Division 13 of the National Defense Research Committee (NDRC), assigned to investigate electrical communication under the direction of C. B. Joliffe (1942-45) and Haraden Pratt (1944-45), while Vannevar Bush had chaired the NDRC as a whole. In spite of the declassification of this report, it has continued to languish in obscurity, although PDF versions are now freely downloadable from the Defense Technical Information Center (DTIC) and—in higher quality—from Archive.org, along with a number of other relevant reports at DTIC:
- Final Report on Project C-55, Telegraphy Applied to TDS Speech Secrecy System, Oct. 31, 1942.
- Final Report on Project C-50, Continuously Coded TDS, November 1, 1943.
- Final Report, Project 13.3-86, Spectrographs for Field Decoding Work, May 30, 1944.
- Final Report on Project C-43, Continuation of Decoding Speech Codes, Part I: Speech Privacy Systems – Interception, Diagnosis, Decoding, Evaluation, October 12, 1944.
- Final Report on Project 13-106, Speech Privacy Problems, August 18, 1945.
I’ve based the present article on this relatively low-hanging fruit, and all images and sounds have been extracted specifically from the Archive.org version of Speech and Facsimile Scrambling and Decoding, which can be downloaded in superbly high resolution. However, the National Archives and Records Administration (NARA) also appears to hold other declassified materials concerning the same projects, listed here, which would surely repay investigation.
So what strategies for voice scrambling were known in the early 1940s? Here’s a non-exhaustive list:
- Frequency Inversion: The frequency spectrum is flipped upside down around a center frequency, so that higher frequencies become lower ones and vice versa.
- Frequency Displacement: Frequencies are shifted upwards by a certain amount in a linear fashion that scrambles harmonic relationships.
- Speed Wobble: The signal is recorded in a form which allows it to be alternately slowed down and speeded up.
- Frequency-Band Shuffling: The frequency spectrum is split into multiple sub-bands, and these are shuffled out of order and/or individually inverted, sometimes with periodic variation among permutations.
- Time Division Scrambling: The signal is recorded in a form which splits it into time segments that are shuffled out of order and/or individually reversed.
- Multiplexing: One or more coded channels alternate among multiple source signals, with alternation occurring either over time or among split frequency bands.
- Masking: Noise from a “coding wave” is introduced to the source signal, either by addition or multiplication.
Paleospectrophony enables us to hear examples of each of these strategies dating from the 1940s, although some of the examples were mocked up by manipulating other spectrograms rather than recorded from actual scrambled audio signals, and some of the scrambled signals seem themselves to have been contrived just for purposes of demonstration.
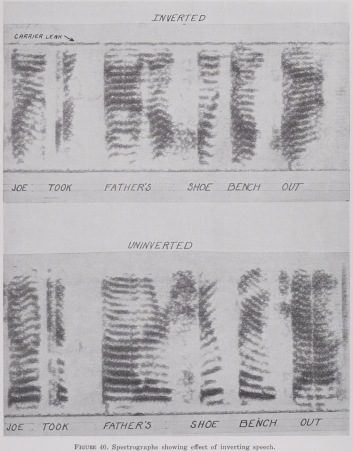
“Inverted speech,” according to David Kahn in The Codebreakers: The Story of Secret Writing, “sounds like a thin high-pitched squawking, ringing with bell-like chimes. The word company resembles CRINKANOPE, Chicago, SIKAYBEE” (p. 552). Figure 40 in Speech and Facsimile Scrambling and Decoding compares an inverted version of the telephone test-phrase “Joe took father’s shoe bench out” (top) with an uninverted version. Encoding relied at the time on modulating the audio signal by a carrier frequency, equivalent to multiplying it by a sine tone at that frequency, which creates two mirror-image versions of the source: an upper sideband the right way up but transposed to higher frequencies, and a lower sideband upside down but covering the same frequency range as the source (up to the modulation frequency). For inversion, only the lower sideband is transmitted. In the example shown, the “carrier leak” represents some of the carrier frequency leaking through into the transmission.
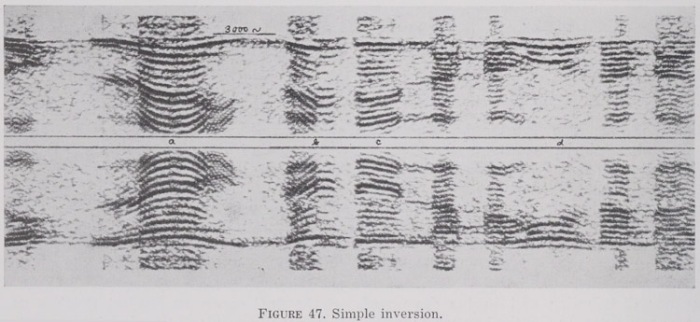
The next plate illustrates another simple inversion (top), with a second spectrogram generated with an upside-down frequency axis from the same inverted audio source (bottom). The modulation frequency is 3000 Hz. In my audio file, I play both of these spectrograms followed by an attempt to decrypt the audio from the top spectrogram by inverting it at 3000 Hz. The speech doesn’t appear to be in English. Could this be an actual snippet of an intercepted communication?
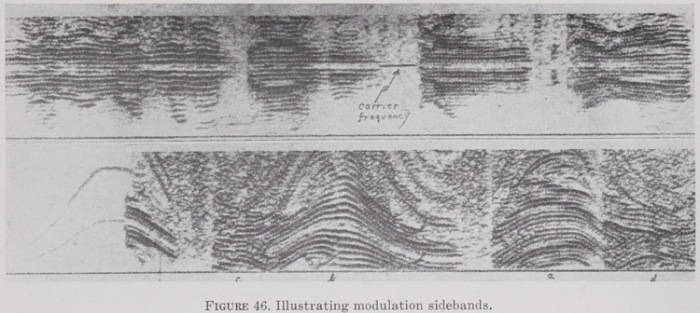
In the following pair of images, the top spectrogram shows both the upper and lower sidebands of a speech signal modulated with a 2000 Hz carrier frequency, illustrating the point that these are mirror images of each other. Simple inversion wasn’t very effective as a method of ensuring privacy, but there were ways to make it more secure; for example, the lower spectrogram shows a speech signal modulated by a carrier frequency that has been “wobbled at a rather slow rate.” Decryption would have required the receiver to vary its carrier frequency perfectly in sync with the one being used for transmission. In my audio file, I first play both spectrograms “as is,” and then I present decrypted audio from the lower and upper sidebands of the top spectrogram.
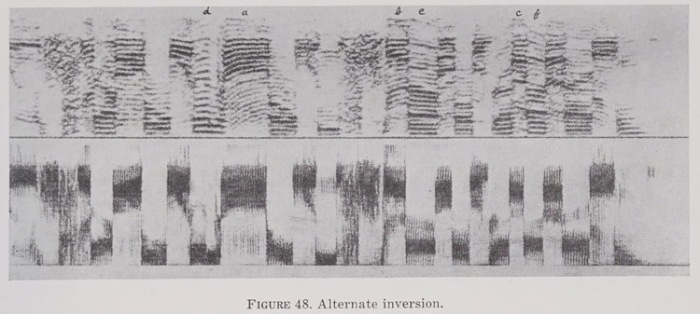
Another way to mix things up was to alternate rapidly between inverted and uninverted signals (which, again, would have required the transmitter and receiver to be perfectly in sync). The plate below illustrates this technique with two spectrograms generated from the same audio source: one narrow-band and one wide-band. In my audio file, I play them first “as is,” and then decrypted to reveal one of the standard test phrases used in spectrographic experiments at the time: “We shall win or we shall die.”
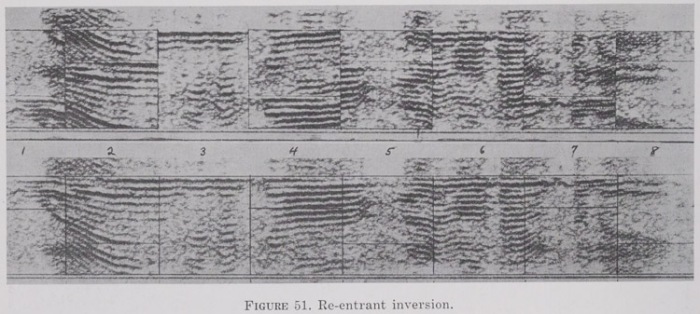
The next plate was “artificially produced by cutting up and rearranging a spectrogram of simple inversion” to illustrate a hypothetical arrangement, re-entrant inversion, that apparently hadn’t yet actually been detected or implemented: “inverting successive elements about frequencies of 1,000, 2,000, and 3,000 cycles, respectively, removing the upper sideband, and replacing it with that portion of the lower sideband extending below about 200 cycles.” The top spectrogram shows the results of this process, while the bottom spectrogram shows a simple inversion of the same audio source (although this, too, doesn’t look “real,” since the range above the modulation frequency doesn’t behave as expected). In my audio file, I play both spectrograms followed by a decrypted version of the lower one which reveals the spoken sentence “Will you go far away from me.” (At least, that’s what I think I hear.)
FREQUENCY DISPLACEMENT
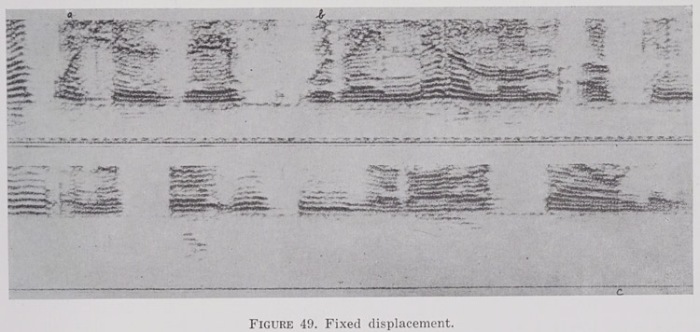
This can be of two types. One is “fixed displacement,” in which all frequencies are shifted upwards by a consistent amount. This was achieved through modulation by a carrier signal in much the same way as simple inversion, except that the lower sideband was suppressed instead of the upper one. It’s important to note that the effect here is not the same we’d get from using the “pitch shift” feature of modern sound editing software with a conventional phase vocoder (which didn’t yet exist in the 1940s). That would have raised all frequencies based on an exponential scale, multiplying their values in Hertz by some factor, such that harmonics would continue to coincide as they had in the source. Modulating by a carrier frequency and then taking the upper sideband instead raises all frequencies based on a linear scale, adding the carrier frequency in Hertz to all of them and thereby scrambling the original harmonic relationships, with a much more pronounced impact on intelligibility. For example, 200 Hz and 400 Hz in the source might become 2000 Hz and 4000 Hz in the first case (×10), but 2200 Hz and 2400 Hz in the second case (+2000). My audio file presents both spectrograms encrypted and then decrypted in turn to reveal snippets of speech, seemingly cut from longer utterances, one of which includes the phrase “with a minimum of.”
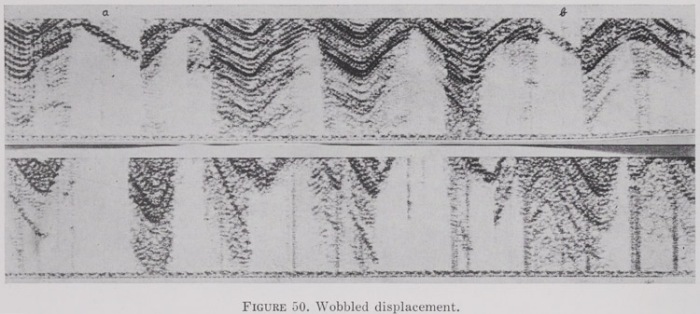
As in the case of inversion, another option here was wobbled displacement, with the carrier frequency varied over time.
SPEED WOBBLE
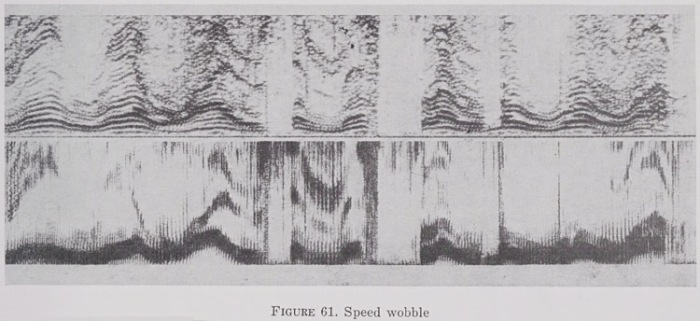
The technique of raising or lowering the playback speed of recorded speech by a fixed amount must have been considered so trivially easy to detect and undo that we don’t even find it discussed. However, some attention is given to the strategy of varying the playback speed by “wobbling the speed of a phonograph record or magnetic tape.” Applying such a system would have required building a recording device into both the transmitter (to apply the wobble) and the receiver (to remove the wobble), and synchronizing the two. The text implies that time-delay systems were generally expected to use magnetic tape, which adds a new dimension to the historical significance of Allied knowledge about secret German advances in tape-recording technology during this period: this would have been of interest not only for the assessment of “clear” radio broadcasts of unusually high-quality prerecorded speech, but also for the diagnosis and cracking of speech scrambling systems.
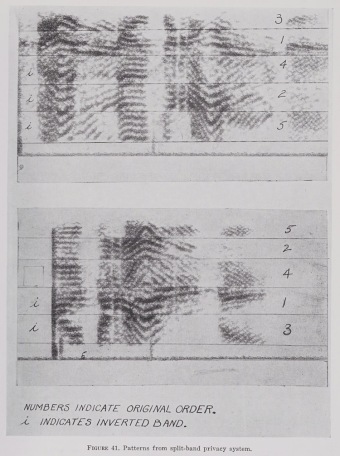
Frequencies could be shuffled as well as inverted through a combination of modulation and band-pass filtering. Figure 41 shows two different mocked-up scrambles in which all bands have been shuffled out of order and some have also been inverted. In my audio file, I present both scrambled versions, followed by audio generated from unscrambled versions of both spectrograms with the bands rearranged and flipped as necessary. The decrypted audio sounds reasonably like natural speech, but I’m not sure of the words.
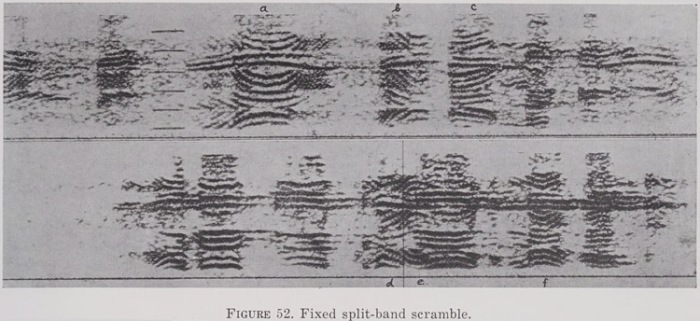
The simplest version of this approach was the “fixed split-band scramble” in which the treatment of the different frequency bands is consistent over time. In the next plate presented below, for example, the code for both spectrograms is consistently “4, 2′, 1, 5′, 3′, the primes denoting inversion.” The text describes various clues that could be used to help crack such codes, some of which involved the gradient of curves associated with speech intonations: steeper curves corresponded to higher frequency ranges, while curves that ran in opposite directions corresponded to inversions. The hope was that these patterns might be apparent to the eye even if they were opaque to the ear.
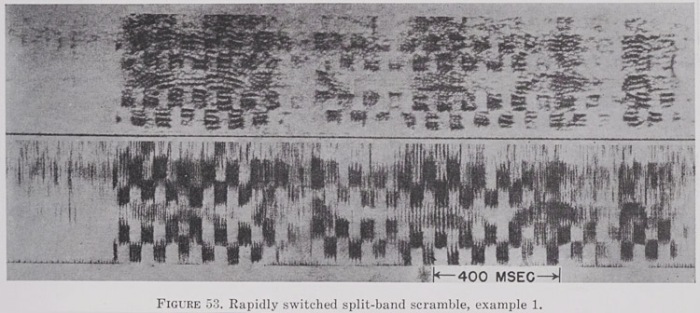
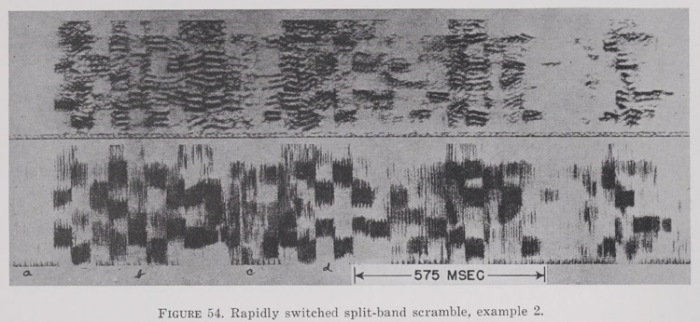
An added layer of security could be introduced by rapidly alternating between multiple codes. The next two plates present examples of this type, each showing the same audio as a narrow-band spectrogram (top) and a wide-band spectrogram (bottom). I haven’t tried to decrypt them.
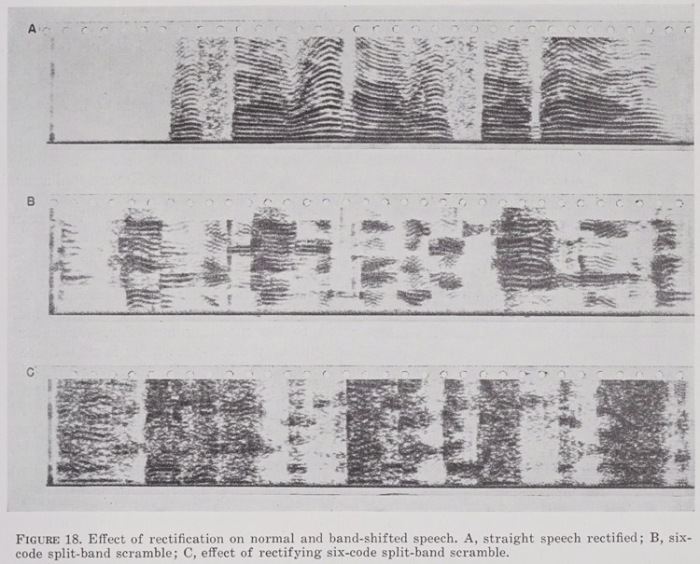
Next is an illustration of rectification, in which negative amplitude values are converted into positive ones. This wasn’t presented as a speech-scrambling technique, but rather as a diagnostic technique. As the text states: “Rectifying normal speech does not add inharmonic components, whereas rectifying speech that contains band shifts results in inharmonic components. The upper spectrogram shows rectified straight speech. This looks perfectly normal except that the frequency range is somewhat more completely covered with harmonics than is the case in normal speech. The second spectrogram shows a sequence of split-band scrambles. The third spectrogram shows a similar sample rectified, with none of the elements decoded. Rectifying the undecoded elements results in a complete smear in the spectrogram compared to the rectified straight speech. Properly decoded elements will stand out more clearly against the background of rectified scrambled speech.”
TIME DIVISION SCRAMBLING
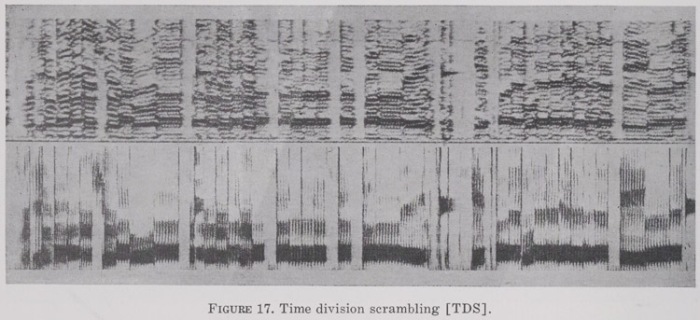
Another scrambling technique that involved the use of a recording device for time delay was time division scrambling, or TDS, in which segments were shuffled out of chronological order. This could be achieved in both transmission and reception by recording the signal onto a tape loop and then using multiple playback heads to read pieces of the loop in an altered sequence.
The plate below illustrates a recommended method for cracking a TDS code. A “synchronizing pulse” marks the boundaries of the looped cycle, while visible discontinuities in the harmonics mark the boundaries of individual segments. The cryptanalyst could cut the segments into strips and rearrange them to find the pattern with the most plausible harmonic continuities, presuming the same pattern repeated between sync pulses.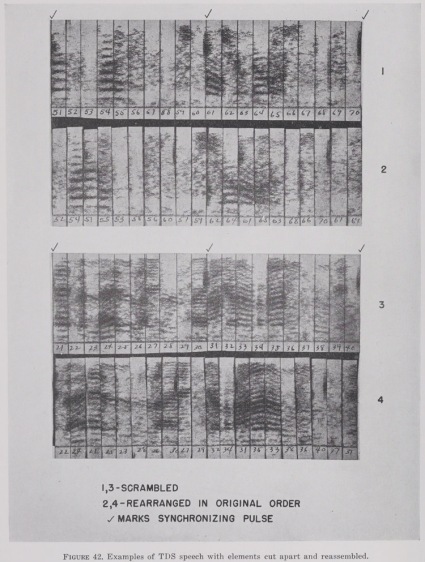
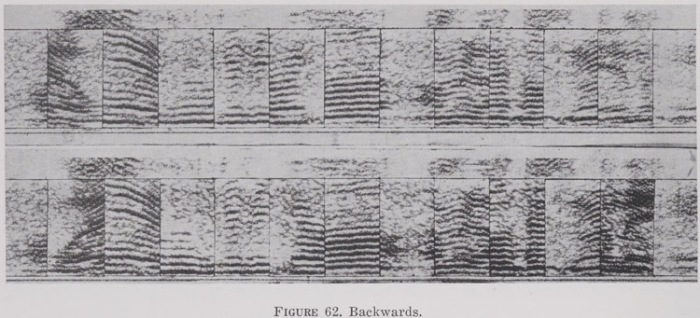
The next plate shows a mock-up of another kind of time-delay system in which segments are presented in the correct order, but with each segment reversed (top), or with only alternate segments reversed (bottom). My audio file presents both examples encrypted, and then both examples decrypted to reveal a test sentence we’ve already encountered above: “Will you go far away from me.”
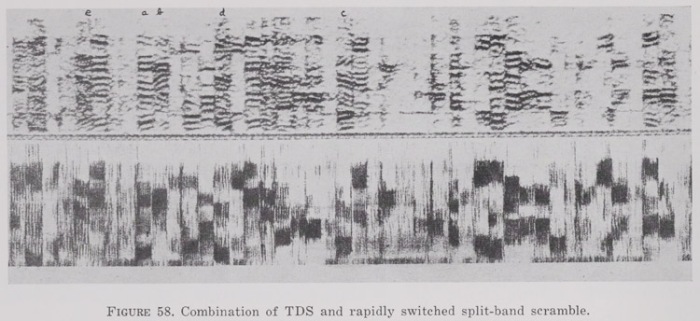
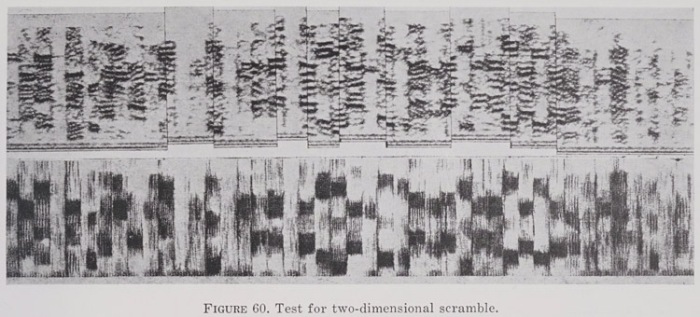
The various techniques we’ve examined so far could also be combined with each other. The plate below illustrates a combination of TDS with a split-band scramble switching rapidly between different codes. In this case, the time-scrambling and band-splitting have both operated on the same segments, with the same segment boundaries.
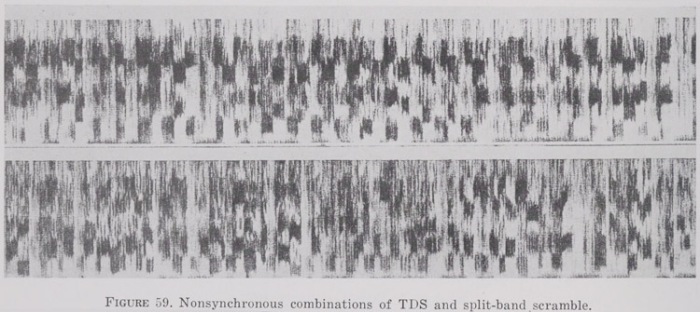
And here’s the same thing, but with the two switching systems operating independently so that the segment boundaries no longer coincide: “The split-band code is changed at intervals of about 40 msec, whereas the length of the TDS elements is about 34 msec.” The text refers to this as a nonsynchronous two-dimensional scramble and treats this as a full-fledged two-dimensional scramble, in contrast with cases of the previous type.
The next plate illustrates a recommended strategy for identifying nonsynchronous two-dimensional scrambles: cutting a spectrogram in half in the middle of vertical bands and shifting the pieces up or down by one harmonic to see if the harmonics continue to line up or not. With a nonsynchronous two-dimensional scramble, they wouldn’t.
Yet another method of scrambling speech in the time domain was to split the signal into multiple frequency bands and then to apply a different delay to each one, as shown here: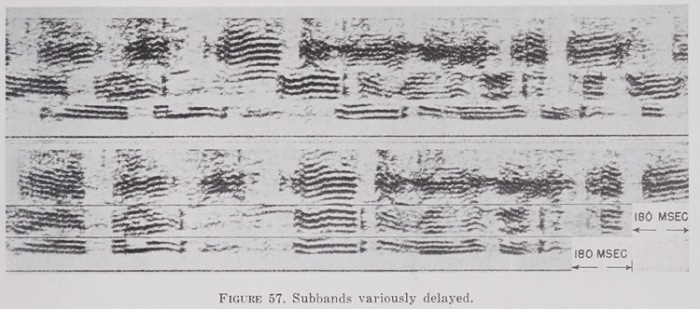
MASKING
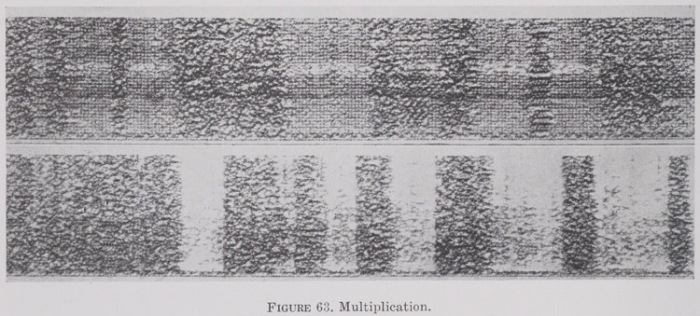
Masking entailed introducing “noise” into the signal on the transmitting end and then removing it on the receiving end. This could be done through addition, essentially just mixing the speech with a second source, but it could also be done by multiplication, which is the more technically interesting approach.
The RCA-Bedford Speech Privacy System (Project C-54, Contract No. OEMsr-592, Radio Corporation of America), described in the text at p. 25, was associated with a unit called the RCAL-1. During coding, the source signal was multiplied by a wave k, synthesized based on code discs. For decoding, it was then multiplied by a reciprocal wave 1/k, which introduced brief gaps in the decoded output wherever k=0. The coding and decoding waves at the sending and receiving stations were synchronized with each other by a pulse inserted into the coded signal every 0.01 second, 0.001 second in duration. Any content at 1000 Hz was also replaced at the outset by a 1000 Hz pilot tone of constant amplitude. This meant that the source signal could be compressed before coding in order to disguise speech cadences and then re-expanded after decoding using the amplitude of the pilot tone as a reference.
The RCA-Bedford system was based on the scrambling of waveforms, and its coded signals could be analyzed pretty effectively from a code-cracking standpoint using an ordinary oscilloscope with its display adjusted to match the synchronization pulse. In this way, the zero crossings of a short and repetitive coding wave could be inferred from patterns of zero crossings in the coded signals. It turned out in practice that applying a square wave based on these zero crossings to the coded signal—or even another wave with similar zero crossings—was enough to crack it. By varying and lengthening the coding waves, however, it was felt that the system could be made relatively secure.
The plate below probably illustrates the RCA-Bedford system in action. The top spectrogram shows a signal that has additionally been masked by a brief blast of noise at 10 msec intervals.
MULTIPLEXING
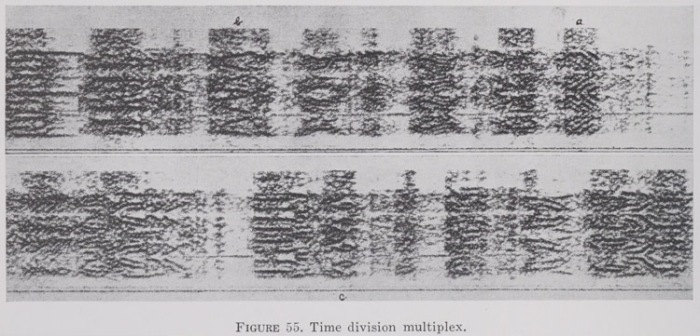
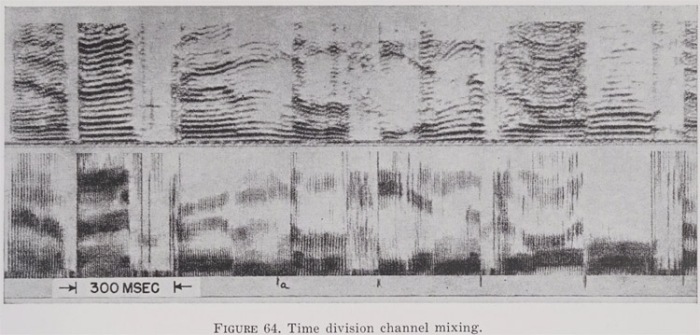
The text states: “Time division multiplex [TDM] is a system in which N separate signals occupying the same frequency range are sent over a single line, each signal being transmitted only 1/Nth of the time.” In this particular case, the separate signals are all four 600-cycle sub-bands of the same speech signal all shifted down to the lowest frequency range, swapped out at a switching rate of 600 per second.
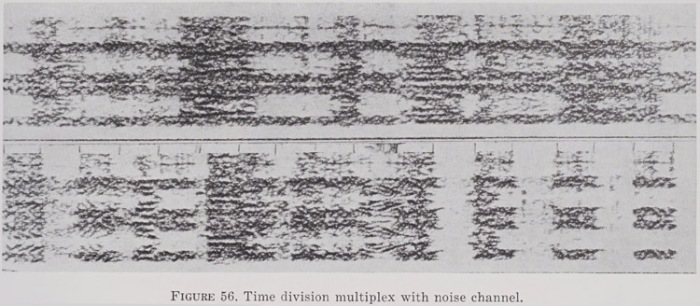
And here’s the same thing again, except that one sub-band has now been replaced with a noise channel.
Another multiplexing strategy was for the transmission on one channel to alternate rapidly between two entirely different speech signals while the “missing” halves of the same two signals were transmitted on a different channel, as shown here:
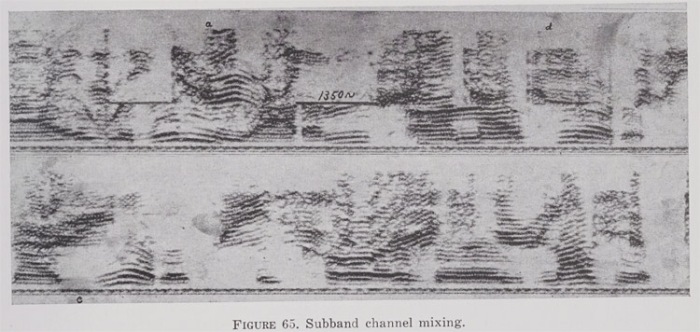
Or instead of switching back and forth between two sources over time, continuous sub-bands of the two sources could instead be combined, as here:
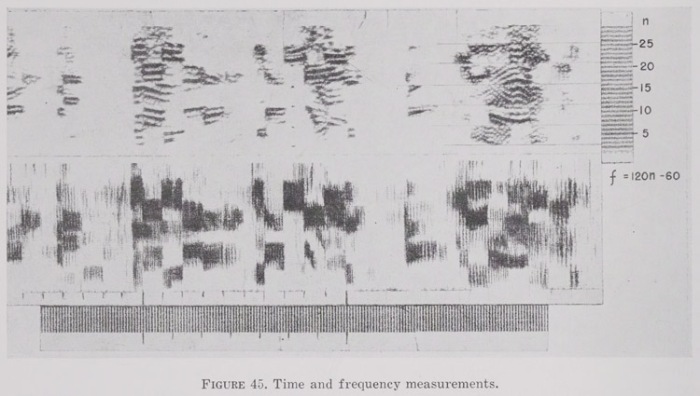
Of course, all the examples I’ve presented above were designed to be interpreted visually, which made it possible to measure both the frequency and time domains as illustrated below.
The secondary literature contains scattered references to the secret military origins of the first successful sound spectrograph, but few authors have elaborated on the important connection with ciphony. Here’s what birdsong scholar Peter Marler has to say:
Around 1940, a group of researchers at the Bell Telephone Laboratories decided that it was time to develop methods for making the details of speech more visible and intelligible, in part because they thought it might help in teaching deaf people to learn to speak and use the telephone. Also it was wartime and, as with other acoustic technologies, another driving force was the need to monitor movements of ships and submarines, analyzing their far-traveling ocean-born sounds, each with its own particular signature. As a consequence, many of the details remained classified until after the War was over. (Peter Marler, “Science and birdsong: the good old days,” in Nature’s Music, p. 1).
Marler’s reference to the sound spectrograph being investigated as a tool for monitoring ships and submarines is borne out by the Summary Technical Report for Division 6, Volume 9, Recognition of Underwater Sounds (1946), which was declassified in 1958, and which contains some spectrograms, called “time-frequency-intensity analyses,” on pages 44-46; and also by Volume 7, Principles of Underwater Sound, which features a few spectrograms starting at page 238. Gregory Radick cites Marler’s account but qualifies it as follows:
Stephen Crump (pers. Comm., November 2005), whose father started Kay, told me that he recalls the sound-spectrograph work at Bell Labs being done not for antisub purposes but for codebreaking—though he was not at all sure, and added that such projects were often “compartmentalized” for security purposes, so it was not always clear even to those who worked on them what they were for. (Endnote 81, pages 455-56, Gregory Radick, The Simian Tongue.)
Crump may not have been “at all sure” about the codebreaking part, but Mara Mills—who is without question the leading historian of the sound spectrograph—represents this project as a firmly established part of its genesis and the origin of the “first serviceable model”:
Bell engineers initially proposed the spectrograph to improve telephone transmission as well as to support oral education and visual telephony for deaf people. The first serviceable model was built during World War II, as part of a cryptanalysis endeavor with the military. Spectrograms exposed the coding of telephone communication: temporal inversion, time-division scrambling, masking with noise, or the shuffling of frequency bands. (Mara Mills, “Deaf Jam: From Inscription to Reproduction to Information,” p. 37.)
I’ve seen only one secondary work that goes into much detail about the spectrograph’s role in the ciphony project: David Kahn’s The Codebreakers (1967). Kahn’s book is well known and regarded as a classic in the history of cryptography, but for whatever reason, it’s rarely cited in works on the history of the spectrograph, one exception being Johannes Fehr’s article “‘Visible Speech’ and Linguistic Insight.” Maybe military intelligence projects aren’t the only ones to have been “compartmentalized.” In any case, The Codebreakers (pp. 551-560) offers the best general-audience overview of early ciphony, summarizing most of the approaches outlined above and likening some of them to analogous methods of text encipherment. Even so, Kahn wasn’t able to tell the whole story, since the digital SIGSALY system that superseded the various analog techniques in 1943 was still classified in 1967, and not revealed until 1976; but he covers it in follow-up article, “Cryptology and the Origins of Split Spectrum.” Kahn’s accounts are further complemented by Marvin Lasky’s review of the military use of the spectrograph to study underwater sounds.
Meanwhile, the declassified documents I’ve tapped for this post contain a few nicely contemporaneous accounts of the ciphonic roots of sound spectrography, including this one:
Early in October, 1940 there was set up in the Communications Division of N.D.R.C. a subcommittee on Speech Secrecy. This group was to consider both the scrambling and unscrambling of telephone signals. It was soon recognized by them that the decoding problem was of primary importance both as a means for evaluating privacy systems for possible use by the Services and for decoding possible enemy signals. Realizing that the ear has very limited capabilities for analyzing scrambled speech Mr. R. K. Potter invented the sound spectrograph to provide speech patterns which could be interpreted by the eye.
Early in 1941 a rough laboratory model of the sound spectrograph became available in Bell Telephone Laboratories Inc. Through Dr. O. E. Buckley, chairman of the Speech Secrecy Section of N.D.R.C. arrangements were made for a demonstration of the sound spectrograph to various N.D.R.C. representatives including Dr. V. Bush.
As a result of the above described demonstration and subsequent Committee action Project C-32, the forerunner of Project C-43, was organized in the fall of 1941 with the immediate objective of producing a sound spectrograph in such form that it would be useful for diagnosing and decoding speech scrambling systems. In project C-32, “Privacy Cracking”, a finished model of the sound spectrograph was constructed and its application to decoding work was successfully demonstrated to representatives of the Army, Navy and N.D.R.C.
Upon the termination of C-32 on February 1, 1942, it was decided that the work initiated under that project should be continued. Accordingly Project C-43, “Continuation of Decoding Speech Codes”, was authorized for one year, effective February 2, 1942. The project anticipated some routine decoding, the production of duplicate equipment to be used by the Army and Navy intelligence services and further studies of decoding tools and methods. At that time the Army and Navy military officers were relying almost entirely upon this project to furnish the above services until they could be provided with suitable equipment and could obtain trained personnel. Based on the needs of the military this project was thrice extended. (Final Report on Project C-43, Part I, p. 1.)
And this one:
In March 1941 an early laboratory model of the sound spectrograph was demonstrated to Dr. V. Bush as an instrument that with further development might be useful in studies of telephone privacy. It was appreciated at that time that the need might arise for intercepting communications in scrambled speech and decoding them. It was also appreciated that new scrambling systems might be encountered and that means would be needed for diagnosing such systems. For such a purpose the unaided ear has very limited capabilities. Such things as oscillograms, which show the wave form, also provide little in the way of clues as to the mechanism by which the wave form was changed. Project C-32, the forerunner of Project C-43, was therefore organized in the Fall of 1941, and its immediate objective was to produce a sound spectrograph in such a form that it would be useful for diagnosing and decoding speech scrambling systems.
About a month before the attack on Pearl Harbor, patterns that could be used for decoding work were being produced with a breadboard model, and the first finished model of the spectrograph was available by the end of that year. Additional models of the spectrograph have since been built for the use of the armed services, incorporating improvements in operation and ruggedness. (Final Report on Project C-43, Part I, p. 7.)
Sound spectrography is an important and distinctive hermeneutic for “reading” recorded sounds, and it appears that it was applied quite intensively to ciphony before it was applied with equal seriousness to any other subject (“visible speech,” birdsong, etc.). The codebreaking project described above was therefore a groundbreaking step in the evolution of phonographic interpretation, and it deserves to be better known than it is. At the same time, it’s the only project of which I’m aware that left behind spectrograms of historically significant subjects it seems we can’t otherwise hear: namely, the actual sounds of speech scrambled during the 1940s.


Pingback: All Griffonage That On Earth Doth Dwell | Griffonage-Dot-Com
Pingback: “Wan Dawo Jo”: The First Ethnomusicological Spectrogram | Griffonage-Dot-Com